Produced electric power until now
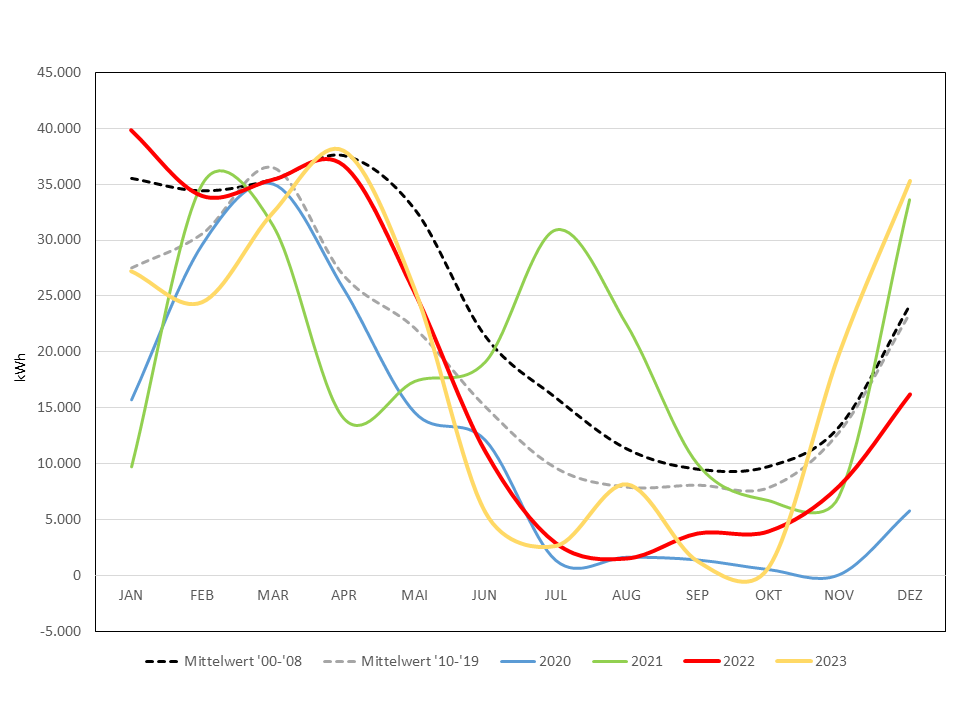
After some difficulties in the first month the turbine is working very well. Here you can see the output of the plant until now. The first graph shows the monthly production.
Monthly output of kWh by year
| Monthly output of kWh by year | |||||||||
|---|---|---|---|---|---|---|---|---|---|
| Ø '00 - '09 | Ø '10 - '19 | 2020 | 2021 | 2022 | 2023 | 2024 | 2025 | 2026 | |
| Jan | 32,902 | 27,514 | 15,689 | 9,687 | 39,808 | 27,251 | 38,522 | 39,504 | 25,928 |
| Feb | 31,292 | 30,569 | 29,578 | 35,021 | 33,926 | 26,469 | 34,729 | 40,222 | 23,194 |
| Mar | 32,095 | 36,463 | 34,984 | 31,294 | 35,374 | 32,471 | 29,836 | 38,981 | 39,119 |
| Apr | 34,436 | 26,823 | 25,595 | 14,024 | 36,654 | 38,024 | 24,478 | 24,478 | 24,189 |
| May | 30,029 | 22,147 | 14,570 | 17,331 | 25,311 | 25,702 | 7,926 | 14,395 | |
| Jun | 19,747 | 15,108 | 12,077 | 19,073 | 11,065 | 5,698 | 19,471 | 6,679 | |
| Jul | 14,288 | 9,606 | 1,316 | 30,911 | 2,836 | 2,666 | 19,551 | 4,835 | |
| Aug | 10,303 | 7,905 | 1,610 | 22,421 | 1,476 | 8,174 | 16,752 | 2,856 | |
| Sep | 8,631 | 8,085 | 1,367 | 9,951 | 3,174 | 1,290 | 10,691 | 7,027 | |
| Oct | 9,450 | 7,840 | 511 | 6,670 | 3,897 | 714 | 24,674 | 8,510 | |
| Nov | 13,609 | 12,794 | 31 | 7,021 | 7,962 | 19,914 | 17,694 | 14,053 | |
| Dec | 25,312 | 23,411 | 5,757 | 33,612 | 16,171 | 35,331 | 30,911 | 19,184 | |
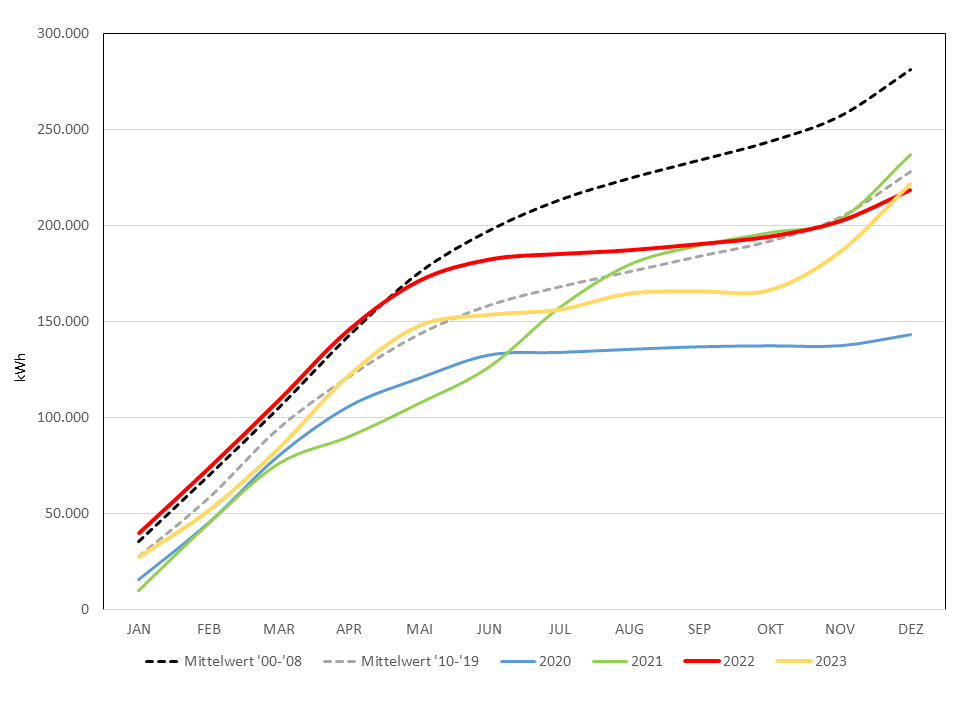
Cumulated output per month
| Cumulated output per month | |||||||||
|---|---|---|---|---|---|---|---|---|---|
| Average '00 - '09 |
Average '10 - '19 |
2020 | 2021 | 2022 | 2023 | 2024 | 2025 | 2026 | |
| Jan | 32,902 | 27,514 | 15,689 | 9,687 | 39,808 | 27,251 | 38,522 | 39,504 | 25,928 |
| Feb | 64,195 | 58,084 | 45,267 | 44,708 | 73,734 | 53,720 | 73,251 | 79,724 | 49,122 |
| Mar | 96,289 | 94,547 | 80,251 | 76,002 | 109,1080 | 86,191 | 103,087 | 118,705 | 88,241 |
| Apr | 130,726 | 121,370 | 105,846 | 90,026 | 145,762 | 124,215 | 127,565 | 143,183 | 112,430 |
| May | 160,755 | 143,517 | 120,416 | 107,357 | 171,073 | 149,917 | 135,491 | 157,578 | |
| Jun | 180,502 | 158,625 | 132,493 | 126,430 | 182,138 | 155,615 | 154,962 | 164,257 | |
| Jul | 194,790 | 168,231 | 133,809 | 157,341 | 184,974 | 158,281 | 174,513 | 169,092 | |
| Aug | 205,093 | 176,136 | 135,419 | 179,762 | 186,450 | 166,455 | 191,265 | 171,948 | |
| Sep | 213,724 | 184,221 | 136,786 | 189,713 | 190,164 | 167,745 | 201,956 | 178,975 | |
| Oct | 223,174 | 192,061 | 137,297 | 196,383 | 194,061 | 168,449 | 226,630 | 187,485 | |
| Nov | 236,783 | 204,855 | 137,328 | 203,404 | 202,023 | 188,373 | 244,324 | 201,538 | |
| Dec | 262,095 | 228,266 | 143,085 | 237,016 | 218,194 | 223,704 | 275,235 | 220,722 | |
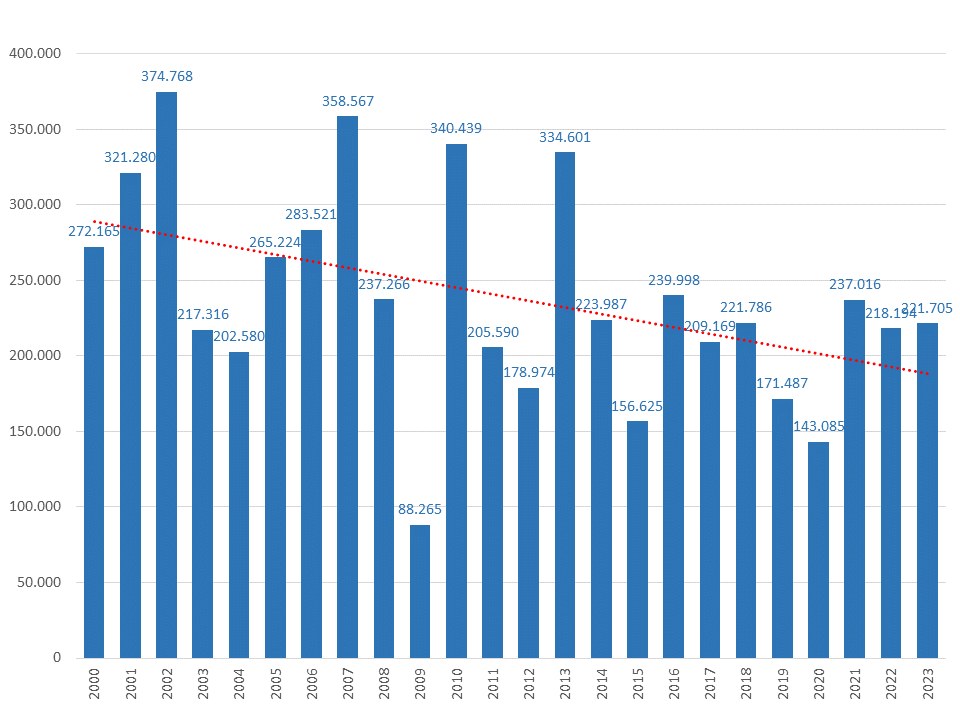
Total output 2000 - 2025
Last update: 2026-05-06